Now, more than ever, organizations rely on data to provide essential decision-making information. Data can be obtained and logged in many ways, from sensors monitoring temperatures to a staff member logging inventory. Having vast amounts of data is advantageous, but managing, preparing, and interpreting it can be challenging. For many years spreadsheets have been the mechanism for data storage. However, the drive to enhance data analysis has increased the popularity of Microsoft’s Power BI platform, providing many workflow options for analyzing and monitoring data, including using Artificial Intelligence (AI) to gain insights.
What is Power BI ?
The core of Microsoft’s Power Platform, Power BI, drives a combination of software applications designed to turn data sources into easily digestible visual and interactive insights. Power BI focuses on delivering clear business intelligence by making it easy to create dashboards of visualized data, such as charts and graphs.
It has grown in popularity as organizations look to streamline their data analysis so they can securely share the most up-to-date information with key stakeholders. This is applicable across almost every market as business analytics impact all verticals, including corporate, finance, education, entertainment, healthcare, hospitality, manufacturing, agriculture and retail.
Common Problems with Data Management
We now live in an era where data is a major contributors to the understanding of the success of companies, teams and individuals. This means organizations have a copious amount of data, often stored as a large disparate library of Excel spreadsheets; leading to some fundamental problems:
- Data is controlled, managed and shared on a departmental basis creating Data Silos.
- Siloed data is often incompatible with other data sets as it is usually put together in a non-standardized way.
- Sometimes data can only be accessible or understandable by the person or persons who originally created it.
- Multiple unlinked files make it hard to cross-reference different data pools to create a holistic picture.
- Data input is often manual, which is subject to human error.
Unifying Data
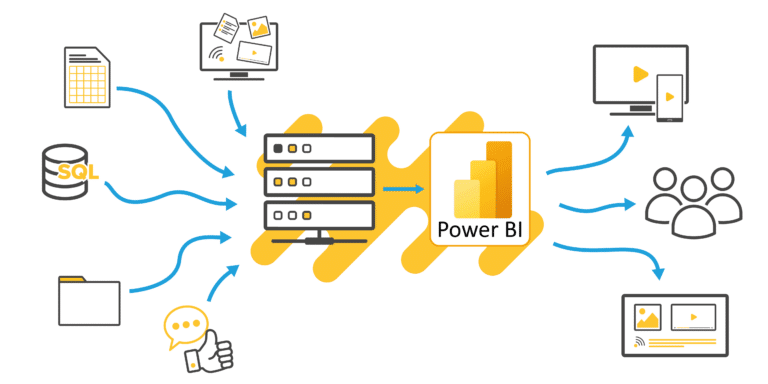
Bringing an entire organization’s data together into a single and central ‘data lake’ or ‘data warehouse’ nullifies the everyday problems of data management as outlined above.
Power BI can then connect to this raw data using its Gateway services and prepare, model, and visualize it to create immersive and interactive analytics. This methodology provides many more options for comprehensive data analysis across a whole organization.
Education – Analysis of student performance can be viewed from across the whole university or college, and also broken down on a departmental basis.
Retail – Sales managers can see up-to-date KPI information and connect to popular CRM platforms
Marketing – Teams can monitor campaign effectiveness and measure social media success
Healthcare – Improvements can be built from the provision of detailed analytics for drug trials, vaccination rates and patient feedback
eCommerce/Sales Teams – Sales performance, units sold, margin and stock levels across all regions can be tracked and locations compared
Finance – Financiers can provide important accounting analysis for clients quickly and clearly

Power BI and Digital Signage
Quickly and securely sending critical Power BI content to digital signage increases an organization’s ability to expose the correct data to the right teams at the right time.
Power BI content can also be displayed alongside other key information to bring all critical messaging together on one signage display. Delivering data via digital signage ensures employees have the most up to date information available to them, and it assists in identifying trends and identifying issues early.
Uniguest recently released a new update for its Tripleplay Digital Signage platform, which included integration with Microsoft’s Power BI. This new integration allows Tripleplay Digital Signage customers to connect their Power BI platform securely and send visualized data to digital signage displays – immediately creating a visual impact which is easy for audiences to digest.
For more information on Uniguest and its industry-leading digital signage and IPTV platform, contact one of our experts.